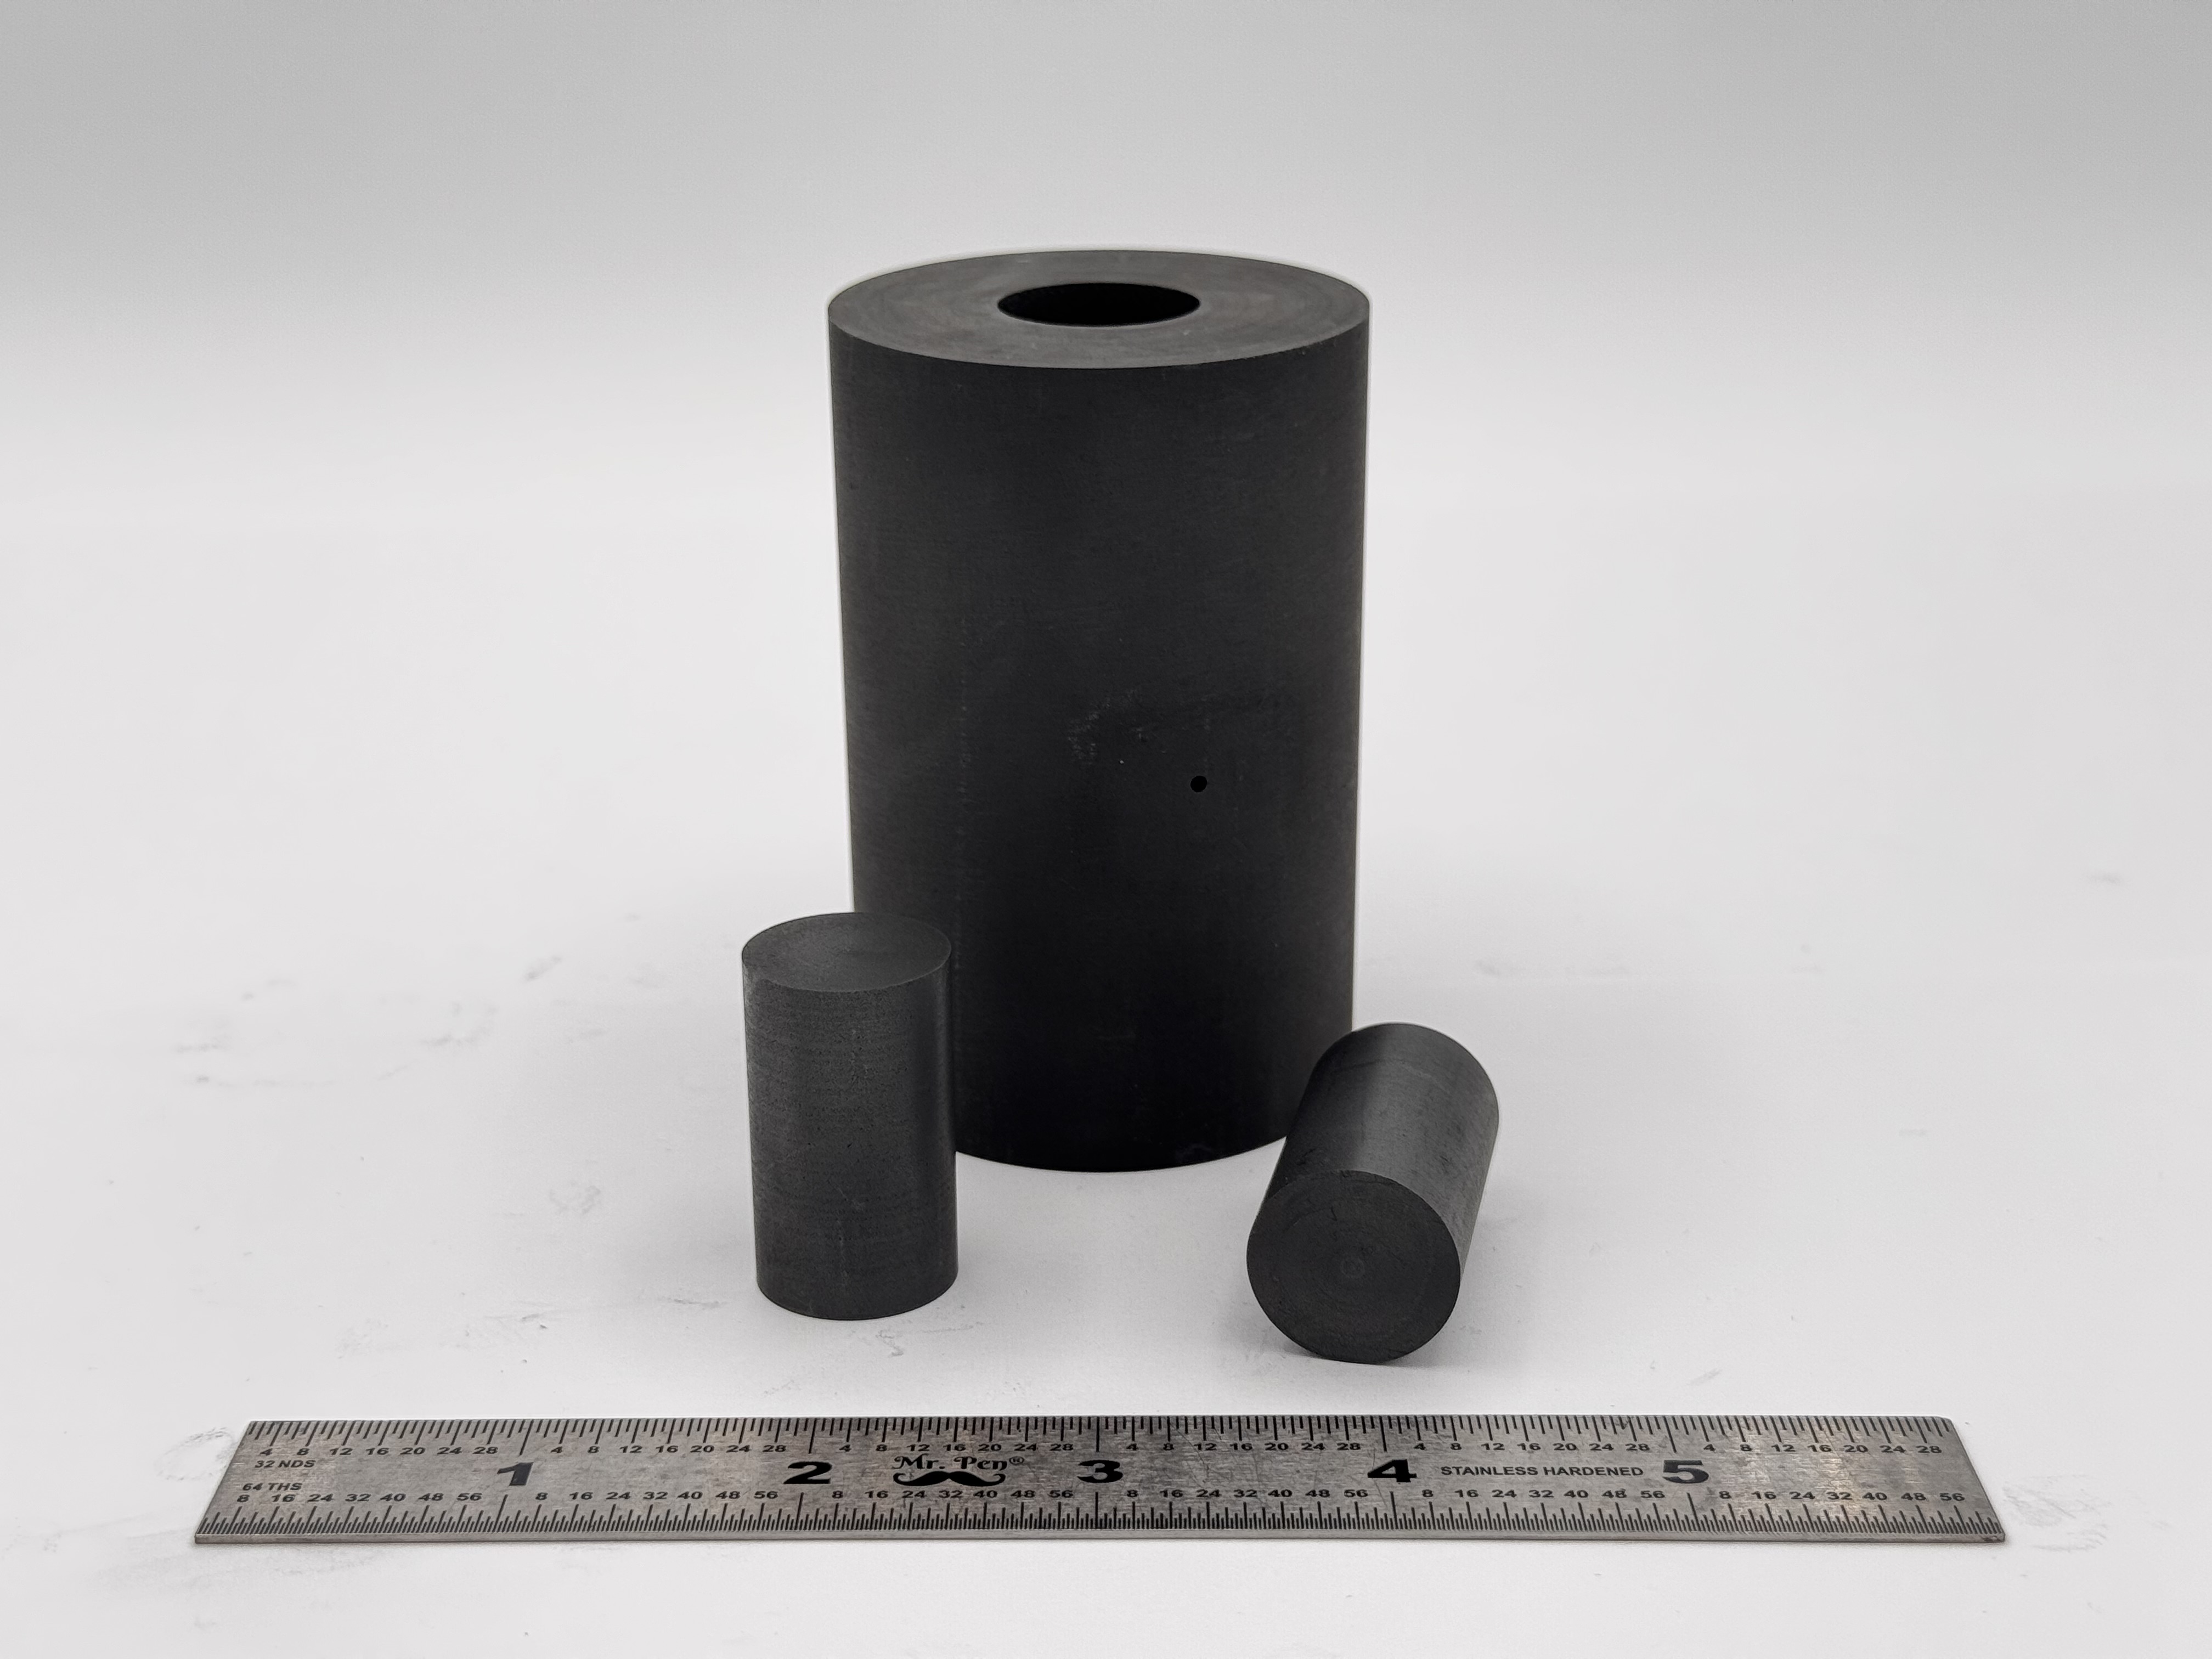
 High Strength SPS Graphite Tooling
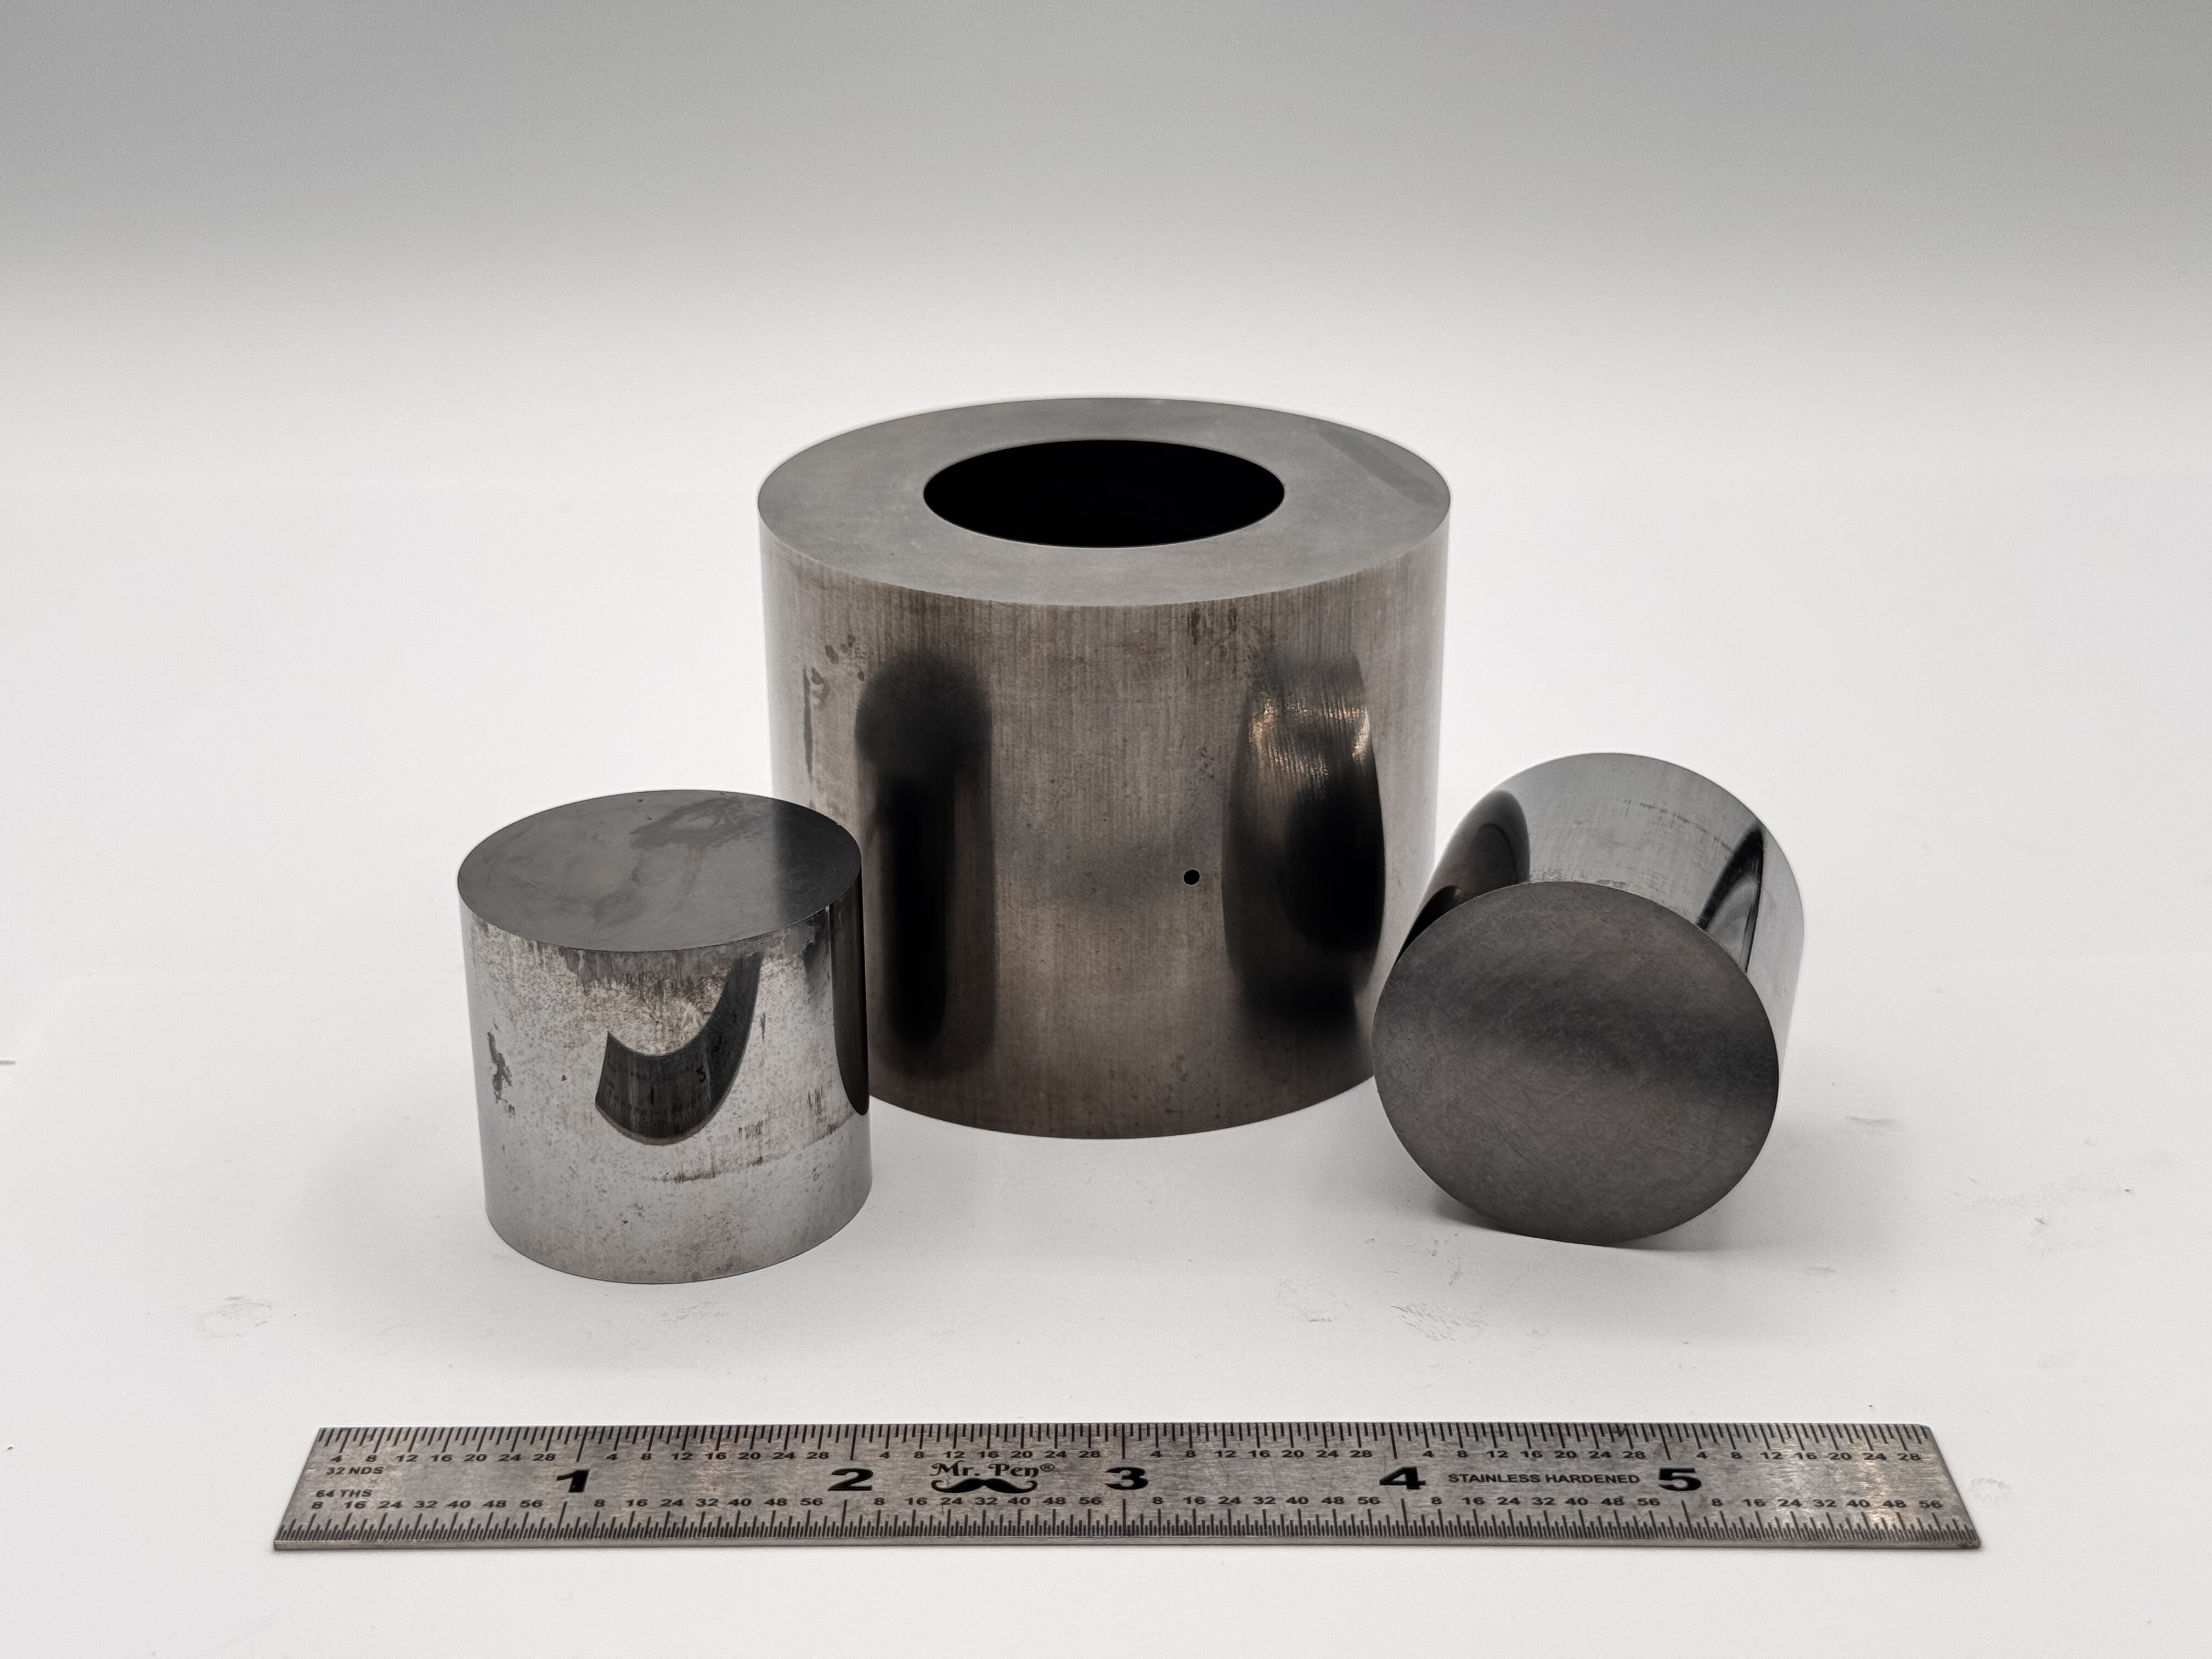 Tungsten Carbide Tooling
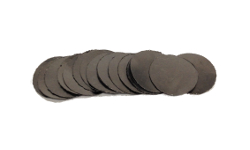 Carbon Graphite Foil / Paper
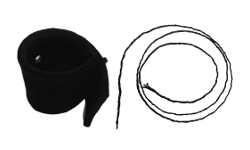 Carbon Felt and Yarn
 Spark Plasma Sintering Systems
 SPS/FAST Modeling Software
California Nanotechnologies Announces FY2025 Results
Jun 26, 2025
- Record annual revenue of US$6,224K representing an 87% YOY increase
- Adjusted EBITDA1 of US$2,559K and Cash Flow from Operations of US$2,917K
- Executing strategy to increase repeatable and higher-scale revenues with commercial orders
TSX VENTURE: CNO
OTCMKTS: CANOF
LOS ANGELES, CALIFORNIA, June 26, 2025 - California Nanotechnologies Corp. ("Cal Nano" or the "Company") is pleased to announce revenues of US$6,224,738 for the fiscal year ending February 28, 2025. This represents an increase of 87% compared to the prior year. Adjusted EBITDA[1] showed significant improvement at US$2,558,515 for the fiscal year ending February 28, 2025, compared with US$1,157,141 in the prior year.
Net loss for the fiscal year was US$158,333, compared to net income of US$381,678 in the prior fiscal year. The lower net income was mainly due to non-cash charges in the amount US$1,252,922 in FY2025 compared to US$164,283 in FY2024, which were related to losses on share purchase warrants[2]. These warrants have led to non-cash charges arising from IFRS accounting rules and the Company's reporting in U.S. dollars, while its outstanding warrants are denominated in Canadian dollars. Once these warrants are exercised or expire, these non-cash gains or losses are expected to cease appearing on the Company’s financial results.
Diluted earnings per share for the fiscal year was $0.00 compared to diluted earnings per share of $0.01 for the same period last year. The financial statements are available on SEDAR+ at www.sedarplus.ca and on the Company’s website.
“This fiscal year saw significant investments in our overall business and strong execution to ramp up our manufacturing services accordingly,” stated CEO Eric Eyerman. “Cal Nano is entering a new phase of maturity where we aim to create more predictability and scale with recurring commercial orders. This is expected to help fill the capacity at our new Santa Ana facility and diversify our revenues across industries and customers. We are off to a good start with the first recurring commercial orders announced in April 2025, and we believe this strategy will contribute to more sustainable growth long-term.”
The improvement in revenue for the fiscal year was mainly due to higher revenue generation from manufacturing services $5,316,068 and Spark Plasma Sintering (SPS) equipment deliveries, which represented US$908,670 of the fiscal year’s sales. The green steel cleantech customer comprised approximately 63% of FY2025 revenues.
Gross margin increased year-over-year due to operational efficiencies and stronger unit economics on sales to R&D program services customers. The Company anticipates fluctuations in gross margin depending on the manufacturing service mix between R&D and commercial, utilization of the new facility, and the quantity of equipment sales.
Adjusted EBITDA for the fiscal year increased due to higher revenue and higher gross margin, which was partly offset by higher operating expenses due to the commissioning of the Santa Ana facility and associated personnel to support higher levels of manufacturing revenues.
Revenues for the fiscal quarter ended February 28, 2025, were US$1,147,522, representing an increase of 17% compared to the same period last year. Q4/FY2025 saw higher revenues from R&D manufacturing and an SPS equipment delivery.
Adjusted EBITDA for the quarter ended February 28, 2025, was US$168,625, representing a decrease of 48% compared to the same period last year. The decrease was mainly attributed to a lower gross margin and higher fixed costs relating to the Santa Ana manufacturing facility. Diluted earnings per share for the quarter were $0.00 compared to diluted earnings per share of $0.01 for the same period last year.
Going into FY2026, Cal Nano believes that it is well positioned to support potential growth with its key investments in personnel, capabilities, and over US$2 million of investment in equipment purchases in FY2025. As a result, the Company expects in the near term that additional capital commitments will be incremental, and the priority is now improving the overall utilization of equipment and contribution margin.
As announced in April, the Company has seen a reduction in activity from its green steel customer after achieving certain performance targets. The transition in the customer’s R&D efforts has impacted results in Q1/FY2026. Cal Nano continues to drive its goal of diversifying its revenues and securing commercial production contracts, which are expected to be more predictable and recurring in nature. Q1/FY2026 has shown progress in this strategy and the concentration in revenues from the green steel customer in the quarter is significantly lower than in FY2025.
Lastly, the Company’s balance sheet in the fiscal year has improved with the complete repayment of its borrowings from Omni-Lite Industries Canada Inc. With the completion of Company’s audited fiscal year results, Cal Nano is no longer considered a going concern and is also exploring potential debt financing options to provide flexibility for future potential equipment and working capital.
Financial Highlights
|
Amounts in USD |
Three months ended February 28, 2025 |
Three months ended February 29, 2024 |
Period-over-period change |
Twelve months ended February 28, 2025 |
Twelve months ended February 28, 2024 |
Period-over-period change |
|
Revenues |
1,146,522 |
983,004 |
17% |
6,224,738 |
3,337,457 |
87% |
|
Cost of Goods Sold |
351,602 |
250,254 |
40% |
1,632,854 |
1,002,866 |
63% |
|
Gross Profit |
794,920 |
732,750 |
8% |
4,591,884 |
2,334,591 |
97% |
|
Gross Margin1 |
69% |
75% |
(600bps) |
74% |
70% |
400bps |
|
Net Income/(Loss) |
(312,484) |
(381,360) |
18% |
(158,333) |
381,678 |
(141%) |
|
Income/(loss) Per Share –Diluted |
$0.00 |
($0.01) |
- |
$0.00 |
$0.01 |
- |
|
Cash Flow from/(for) Operations |
377,009 |
(93,532) |
503% |
2,923,881 |
104,284 |
2,704% |
|
EBITDA1 |
50,308 |
(324,836) |
115% |
780,966 |
633,342 |
23% |
|
Adjusted EBITDA1 |
168,625 |
325,237 |
(48%) |
2,558,515 |
1,157,141 |
121% |
About California Nanotechnologies Corp.
At Cal Nano, we envision a world in which our advanced technologies are used to help make the most innovative products on this planet and beyond. With our unique expertise in processing metallurgic powders into parts, global leaders trust us to help push the boundaries of applied material science. Headquartered in Greater Los Angeles, California, Cal Nano hosts advanced processing and testing machinery and capabilities across two manufacturing facilities for materials research and production needs. Our customers range from Fortune 500 companies to startups with programs spanning aerospace, renewable energy, defense, and semiconductors.
For further information, please contact:
California Nanotechnologies Corp.
Eric Eyerman, CEO
T: +1 (562) 991-5211
info@calnanocorp.com
Panolia Investor Relations Inc.
Brandon Chow, Principal & Founder
T: +1 (647) 598-8815
brandon@panoliair.com
Non-IFRS Measures and Reconciliation of Non-IFRS Measures
This press release makes reference to certain non-IFRS measures. These non-IFRS measures are not recognized measures under IFRS, do not have a standardized meaning prescribed by IFRS and are therefore unlikely to be comparable to similar measures presented by other companies. Rather, these measures are provided as additional information to complement those IFRS measures by providing a further understanding of results of operations of Cal Nano from management’s perspective. Accordingly, they should not be considered in isolation nor as a substitute for analysis of the financial information of Cal Nano reported under IFRS. The Company uses non-IFRS measures such as EBITDA to provide investors with a supplemental measure of operating performance and thus highlight trends in its core business that may not otherwise be apparent when relying solely on IFRS financial measures. Management also believes that securities analysts, investors and other interested parties frequently use non-IFRS measures in the evaluation of issuers. Management also uses non-IFRS measures in order to facilitate operating performance comparisons from period to period, prepare annual operating budgets and assess the Company’s ability to meet its capital expenditure and working capital requirements.
“EBITDA” means the earnings before interest, income taxes, depreciation, and amortization, where interest is defined as net finance costs as per the consolidated statement of comprehensive income.
“EBITDA margin” means the earnings before interest, income taxes, depreciation, and amortization, where interest is defined as net finance costs as per the consolidated statement of comprehensive income as a percentage of total revenues.
"Adjusted EBITDA" refers to earnings before interest, income taxes, depreciation, amortization, share-based compensation, and the unrealized gain on share purchase warrants, with interest defined as net finance costs as per the consolidated statement of comprehensive income.
"Adjusted EBITDA margin" refers to earnings before interest, income taxes, depreciation, amortization, share-based compensation, and the unrealized gain or loss on share purchase warrants, with interest defined as net finance costs as per the consolidated statement of comprehensive income as a percentage of total revenues.
Reconciliations and Calculations
The tables set forth below provides a quantitative reconciliation of Gross Margin and EBITDA, which are Non-IFRS financial measures, to the most comparable IFRS measure disclosed in the Company’s financial statements. The reconciliation of Non-IFRS measures to the most directly comparable measure calculated in accordance with IFRS is provided below where appropriate.
Gross Margin Reconciliation
|
Amounts in USD |
Three months ended February 28, 2025 |
Three months ended February 29, 2024 |
Twelve months ended February 28, 2025 |
Twelve months ended February 28, 2024 |
|
Revenues |
1,146,522 |
983,004 |
6,224,738 |
3,337,457 |
|
Cost of Goods Sold |
351,602 |
250,254 |
1,632,854 |
1,002,866 |
|
Gross Profit |
794,920 |
732,750 |
4,591,884 |
2,334,591 |
|
Gross Margin |
69% |
75% |
74% |
70% |
EBITDA and Adjusted EBITDA Reconciliation
|
Amounts in USD |
Three months ended February 28, 2025 |
Three months ended February 29, 2024 |
Twelve months ended February 28, 2025 |
Twelve months ended February 28, 2024 |
|
Net Income/(Loss) |
(312,484) |
(381,360) |
(158,333) |
381,678 |
|
Depreciation & Amortization |
190,409 |
36,509 |
578,806 |
145,598 |
|
Interest Expense |
4,292 |
20,880 |
191,597 |
106,066 |
|
Income Tax Expense |
168,091 |
(865) |
168,896 |
0 |
|
EBITDA |
50,308 |
(324,836) |
780,966 |
633,342 |
|
EBITDA Margin |
4% |
(33%) |
13% |
19% |
|
Share-based Compensation |
368,053 |
286,817 |
524,627 |
359,516 |
|
Loss/(Gain) on Share Purchase Warrants |
(249,736) |
363,256 |
1,252,922 |
164,283 |
|
Adjusted EBITDA |
168,625 |
325,237 |
2,558,515 |
1,157,141 |
|
Adjusted EBITDA Margin |
15% |
33% |
41% |
35% |
Derivative Liability Recognition for Warrant Issuance under IFRS
On October 30, 2023, the Company successfully closed an issuance of units comprising common shares and warrants, encompassing an aggregate of 5,000,000 warrants, each with an exercise price of CA$0.25. As a result of the Company reporting its financial results denominated in US dollars, and in adherence to the International Financial Reporting Standards (IFRS), the Company is required to report a derivative liability attributable to the aforementioned warrants. Consequently, the Company will recognize a non-cash charge or income inclusion on a quarterly basis, predicated upon the fluctuation in the market price of the Company’s shares, until such time as the warrants either are exercised or expire.
Reader Advisory
Except for statements of historical fact, this news release contains certain "forward-looking information" within the meaning of applicable securities law. Forward-looking information is frequently characterized by words such as "plan", "expect", "project", "intend", "believe", "anticipate", "estimate" and other similar words, or statements that certain events or conditions "may" or "will" occur. In particular, forward-looking information in this press release includes, but is not limited to: future financial results, including anticipated profitability and/or lack thereof; statements about future plans, including statements about the planned expansion of the Company’s manufacturing capacity, and new sites for the Company’s production and headquarters; demand for the Company’s services by current and future customers, including existing and future orders for the Company’s SPS equipment and the anticipated revenue therefrom; and the expected future performance of the Company. Although we believe that the expectations reflected in the forward-looking information are reasonable, there can be no assurance that such expectations will prove to be correct. We cannot guarantee future results, performance or achievements. Consequently, there is no representation that the actual results achieved will be the same, in whole or in part, as those set out in the forward-looking information. Forward-looking information is based on the opinions and estimates of management at the date the statements are made, and are subject to a variety of risks and uncertainties and other factors that could cause actual events or results to differ materially from those anticipated in the forward-looking information. Some of the risks and other factors that could cause the results to differ materially from those expressed in the forward-looking information include, but are not limited to: general economic conditions in Canada, the United States and globally; a significant change in demand for the Company’s services and products; industry conditions, governmental regulation, including environmental regulation; the effects of product development and need for continued technological change; the effect of government regulation and compliance on the Corporation and the industry; research and development risks; reliance on key personnel; operations in foreign jurisdictions; protection of intellectual property rights; contractual risk; third-party risk, risk of technological or scientific obsolescence; dependence of technical infrastructure; unanticipated operating events or performance; failure to obtain industry partner and other third party consents and approvals, if and when required; the availability of capital on acceptable terms; the need to obtain required approvals from regulatory authorities; stock market volatility; competition for, among other things, capital, skilled personnel and supplies; changes in tax laws; and the other risk factors disclosed under our profile on SEDAR+ at www.sedarplus.ca. Readers are cautioned that this list of risk factors should not be construed as exhaustive.
The forward-looking information contained in this news release is expressly qualified by this cautionary statement. We undertake no duty to update any of the forward-looking information to conform such information to actual results or to changes in our expectations except as otherwise required by applicable securities legislation. Readers are cautioned not to place undue reliance on forward-looking information.
Neither TSX Venture Exchange nor its Regulation Services Provider (as that term is defined in policies of the TSX Venture Exchange) accepts responsibility for the adequacy or accuracy of this release.
[1] Non-IFRS Measure
[2] See disclosure under “Derivative Liability Recognition for Warrant Issuance under IFRS”